Why Is Air Monitoring Important?
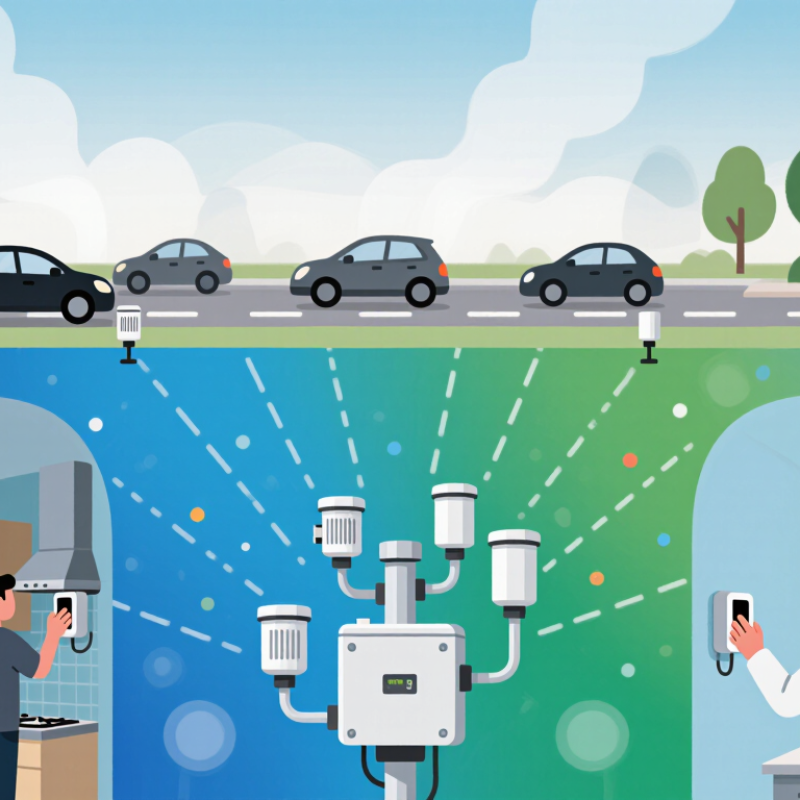
Air Monitoring is the ongoing measurement of pollutants and other conditions that affect the air people breathe. It can reveal changes in particulate matter, gases, temperature, and humidity across indoor and outdoor spaces. These readings help people identify patterns, investigate possible sources, and decide when further assessment may be needed. Small changes matter. Fine particles can rise near a busy road, while indoor pollutant levels may shift during cooking, cleaning, or poor ventilation. A single reading offers only a snapshot; repeated measurements give a more useful view of changing conditions.
Reliable monitoring depends on suitable equipment, careful placement, and regular maintenance. Sensors placed beside an open window may tell a different story from those near a work area. Calibration and clear records also matter, because inaccurate readings can lead to mistaken conclusions. No single sensor explains the whole picture. Even careful systems leave gaps, and unusual results may need expert review rather than quick assumptions. That limitation is worth remembering.
For communities, Air Monitoring can help show where pollution levels may deserve closer attention. For building and facility managers, it can support practical steps such as checking ventilation or reviewing work processes. Good reporting explains what was measured, where, and when, while noting uncertainty and equipment limits. Understanding why Air Monitoring matters is not just about collecting numbers. It is about using dependable evidence to make informed decisions, protect health, and ask better questions about the air we share.
What Air Monitoring Measures and How It Works
Why Is Air Monitoring Important?
What Air Monitoring Measures and How It Works
Air monitoring measures pollutants in a specific place over time. Depending on the equipment, it may track fine particles such as PM2.5 and PM10, or gases such as ozone, nitrogen dioxide, and carbon monoxide. Some systems also record temperature and humidity, which can help explain changes in readings. A monitor near a busy road may show short-lived particle increases during rush hour. Indoors, readings can shift after cooking or when ventilation is limited. Small shifts matter.
Different sensors use different methods. Optical particle sensors estimate particle levels by measuring how airborne particles scatter light. Gas sensors may use electrochemical reactions to detect changes in particular compounds. Instruments collect readings at set intervals, then display them as current levels or trends.
The numbers are useful, but they are not a complete picture. A sensor may respond to humidity, age, or nearby sources, and a single reading cannot identify exactly where pollution came from. Placement matters. Keep monitors away from blocked vents or direct splashes, and follow the maker’s guidance for maintenance and calibration.
Even careful monitoring leaves gaps; that limitation is easy to overlook when a chart looks precise. Comparing repeated readings with local conditions can make the data more meaningful.
Which Pollutants and Conditions Are Tracked
Why Is Air Monitoring Important?
Which Pollutants and Conditions Are Tracked
Air monitors measure pollutants that can affect breathing and health. Common readings include fine particles, such as PM2.5, and larger inhalable particles, known as PM10. These can come from traffic, construction dust, smoke, or other sources. Nitrogen dioxide is often tracked near busy roads, where vehicle exhaust can raise local levels. Ground-level ozone may increase on sunny days when pollutants react in the air. Some monitoring sites also measure carbon monoxide and sulfur dioxide.
The instruments track more than pollutants. Temperature, humidity, wind speed, and wind direction help explain how readings change. A gust can carry dust away from a street, while still air may let pollution build near buildings. Rain can reduce airborne particles for a time. Weather matters. Readings also vary by location and height; a station beside a road may not reflect conditions in a nearby park. Monitoring does not capture every person’s exposure, either. Indoor air, travel routes, and time spent outside all matter. No monitor tells the whole story, and that limitation deserves attention. Even so, repeated measurements can reveal patterns, such as particle spikes during morning traffic or ozone increases on warm afternoons.
How Air Monitoring Protects Public Health
Why Is Air Monitoring Important?
How Air Monitoring Protects Public Health
Air monitoring turns invisible pollution into information people can use. A station near a school may track fine particles, ozone, and nitrogen dioxide throughout the day. On a hot afternoon, readings can rise as traffic and sunlight shape local air. That matters to children, older adults, and people with asthma or heart conditions. They may need practical warnings before symptoms worsen.
Reliable monitoring also helps health teams and city planners spot patterns. If particle levels repeatedly climb beside a busy road, officials can investigate traffic, construction, or other sources. Public alerts can recommend reducing strenuous outdoor activity during high-pollution periods.
Small detail, real impact.
But measurements have limits. A sensor represents one location, not every street or home, and some devices can drift without maintenance. Weather, building design, and time spent indoors also affect personal exposure. I would not treat one number as a complete picture. Monitoring works best when equipment is checked, results are explained plainly, and communities can see how decisions follow the data. That connection builds trust, though it is easy to overlook.
How Monitoring Supports Environmental and Policy Decisions
Why Is Air Monitoring Important?
Air monitoring turns invisible pollution into evidence that communities and decision-makers can use. Repeated measurements show where pollution rises, when it peaks, and whether interventions make a difference. WHO’s 2021 air-quality report found that 99% of the global population lived in places exceeding its air-quality guideline levels in 2019. Local measurements add context to that broad picture. A roadside sensor may record a sharp morning spike, while a nearby park shows a different pattern.
Those differences can guide environmental reviews, transport planning, and public-health alerts. The U.S. Environmental Protection Agency’s Our Nation’s Air 2022 report states that emissions of six common pollutants fell 78% between 1970 and 2020, while U.S. GDP grew 272%. Monitoring helps agencies track such trends, but it cannot prove which policy caused every change. Weather, traffic, and sensor placement complicate interpretation. That uncertainty deserves attention, not dismissal.
Tips: Compare readings across seasons and locations, and check sensor calibration before drawing conclusions. Combine fixed-site data with carefully validated mobile measurements to spot local hotspots. Share methods and limitations alongside results. Clear evidence builds trust. Even good data can leave gaps, especially where monitoring stations are sparse.
Why Is Air Monitoring Important? — How Monitoring Supports Environmental and Policy Decisions
Air monitoring measures pollutant concentrations over defined periods. These U.S. ambient air quality standards show how measurements can be compared with public-health benchmarks and used to guide environmental management and policy.
| Pollutant | U.S. EPA National Ambient Air Quality Standard | What Monitoring Measures | How the Data Supports Decisions | Environmental and Public-Health Relevance |
|---|---|---|---|---|
| Fine particulate matter (PM2.5) | 9.0 µg/m³ annual primary standard; 35 µg/m³ 24-hour primary standard | Particles with diameters of 2.5 micrometers or smaller, reported as an average over the applicable period. | Helps identify areas that may not meet standards, assess pollution-control plans, and track changes in exposure over time. | Fine particles can penetrate deep into the lungs. They may come from combustion, industry, fires, and atmospheric chemical reactions. |
| Inhalable particulate matter (PM10) | 150 µg/m³ 24-hour primary standard | Particles with diameters of 10 micrometers or smaller, including dust and some combustion particles. | Supports assessment of particulate pollution, dust-control measures, and compliance with the 24-hour standard. | Sources can include road dust, construction, agriculture, and industrial activity; elevated concentrations can affect breathing and visibility. |
| Ground-level ozone (O3) | 0.070 ppm, based on the 8-hour average | Ozone concentrations near the ground, often tracked during warmer months and periods of strong sunlight. | Helps establish air-quality alerts, evaluate regional ozone-control strategies, and determine whether an area meets the standard. | Ozone forms in the atmosphere from nitrogen oxides and volatile organic compounds in sunlight; it can irritate airways and harm sensitive vegetation. |
| Nitrogen dioxide (NO2) | 100 ppb 1-hour primary standard; 53 ppb annual primary standard | NO2 concentrations over short-term and annual averaging periods. | Can help assess traffic- and combustion-related pollution, identify exposure patterns, and inform transport or emissions policies. | Combustion sources include vehicles, power generation, and industrial equipment. NO2 can irritate airways and contributes to ozone and particle formation. |
| Sulfur dioxide (SO2) | 75 ppb, based on the 1-hour primary standard | Short-term SO2 concentrations, including levels near major sources and in surrounding communities. | Supports evaluation of source controls and helps authorities assess short-duration pollution episodes. | SO2 is associated mainly with combustion of sulfur-containing fuels and some industrial processes. It can affect breathing and contribute to particle pollution. |
| Carbon monoxide (CO) | 9 ppm 8-hour primary standard; 35 ppm 1-hour primary standard | CO concentrations averaged over 1-hour and 8-hour periods. | Helps assess combustion-related pollution and determine whether concentrations approach or exceed health-based limits. | CO is produced by incomplete combustion, including vehicle exhaust and fuel-burning equipment. It reduces the blood’s capacity to carry oxygen. |
| Lead (Pb) | 0.15 µg/m³, measured as a rolling 3-month average | Lead concentrations in total suspended particles, commonly monitored near relevant sources. | Supports source investigation, community exposure assessment, and decisions about emissions controls and follow-up monitoring. | Lead can persist in the environment and is especially harmful to children’s developing nervous systems. |
How to interpret the figures: Standards are U.S. EPA National Ambient Air Quality Standards (NAAQS); primary standards are set to protect public health, including sensitive groups. Units and averaging periods are part of each standard. A monitor reading is not, by itself, a complete personal-exposure estimate or proof of a particular health outcome. Standards and monitoring requirements may be updated. Sources: U.S. EPA NAAQS Table and U.S. EPA Air Monitoring.
Where Air Monitoring Is Used and Who Relies on It
Air monitoring is used wherever people need to understand what they are breathing. Outdoor stations track particles and gases near roads, industrial areas, and parks. Inside, schools, hospitals, offices, and homes may monitor fine particles, carbon dioxide, or other specific pollutants. Construction teams and agricultural workers also use monitors to identify changing conditions around dusty tasks or equipment. The right instrument depends on the pollutant and setting. One sensor cannot measure everything. That distinction matters.
Many people rely on these readings. Public health teams use local trends to guide outreach during smoke or pollution events. Facility managers look for ventilation problems, while workplace safety professionals assess exposure during particular tasks. Researchers compare measurements across locations and seasons. Residents may use indoor readings to decide when to ventilate or filter a room, but a single number rarely tells the whole story. Placement, maintenance, humidity, and calibration can affect results. Readings need context. I have seen how a monitor near a doorway can tell a different story from one beside a busy workstation. Even careful monitoring has limits, so clear records and expert interpretation remain important.
Why Is Air Monitoring Important?
WHO annual mean air quality guideline levels for selected pollutants
Air monitoring helps environmental agencies, public health researchers, urban planners, building operators, and employers identify pollution patterns and assess exposure. Measurements can inform public health decisions and actions to improve air quality. Guideline values are health-based recommendations, not necessarily legal limits; local standards may differ.
Source: WHO Global Air Quality Guidelines (2021). Annual mean guideline levels: PM₂.₅ 5, PM₁₀ 15, and NO₂ 10 µg/m³.
English
Česká republika
Deutsch
Dutch
Polska